Analytics Manager 3.0 Release Notes
In this release, Analytics Manager has been greatly expanded, with more functionality and reports. In the new version you can:
- Get reports faster: Streamlined report-pulling process with fewer clicks and quicker turnaround times.
- Custom Date Ranges: Select the date range that makes sense for your business!
- Report scheduling: Reports can be scheduled to run automatically and be delivered directly via email.
Analytics Manager has two sections: Reports and Schedule. In Reports you can run a report, export it, and even schedule it so that it will be automatically run and emailed to others. In Schedule you can edit or delete a scheduled report.
Reports
Analytics Manager comes with eight reports:
Compliance by Driver - shows Hours of Service violations for the drivers in your fleet.
HOS Driver Violations - shows the violations for a specific driver.
State Miles - shows you how many miles your fleet has driven within each state. It can be pulled for any date range within the past 365 days
State Miles by Vehicle - shows miles driven per day and per state for an individual vehicle.
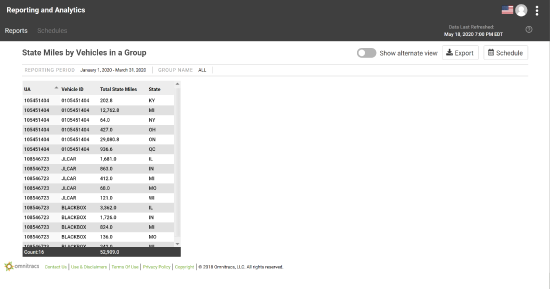
State Miles by Vehicle in a Group - shows all miles driven per state for all vehicles in a selected group.
Driver Scorecard - scores drivers based on safety, fuel, and violations.
Location Summary - shows customers how many stops, the average stoppage time and total stoppage time at locations, within a given time frame.shows customers how many stops, the average stoppage time and total stoppage time at locations, within a given time frame.
Group Efficiency - helps to identify the efficiency of vehicles at locations.
Running a Report
To run a report, click on the report; the report options open. Choose the reporting period; you can click the arrow and choose the quarter you want to include, or you can enter a Start Date and End Date for the report period. Some reports may have additional options to select.

Note: Report data is available for the last 365 days. The report quarter is a calendar year quarter.
Click [Run]. Click [View]. The report opens.

Note: Once the report opens, you can resize the columns or even filter the report to only the data you want to see.
To export the report, click [Export]. Choose whether you want the report exported as a pdf, csv, or xlsx and click [Export].
Scheduling a Report
You can schedule reports to automatically run at regular intervals, and have them emailed to the recipients.
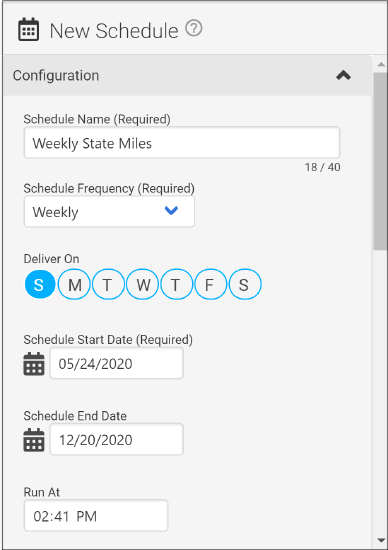
To schedule the report, click [Schedule]. Enter the information to schedule the report, including the schedule name, report to be run and the reporting period, when the report should run and the email addresses the report should be sent to. Click [Create].

Once a report has been scheduled it will appear on the Schedule tab. You can edit the schedule, delete it, or make it inactive from the list on the Schedules tab.
Software Corrections
| Issue Key | Read Me Notes |
|---|---|
| ORA-75 | There was an issue where the data picker was not allowing the user to select the last day of a quarter as the End Date. This has been corrected. |
| ORA-72 | There was an issue that was causing the Date Last Refreshed to be incorrect. This has been corrected and the proper date is shown. |
| ORA-117 | There was an issue where the scheduled run time for a report schedule was preventing the schedule from saving properly. This has been corrected. |
| ORA-115 | ORA is now rebranded as Analytics Manager. |
| ORA-136 | The State Miles by Vehicles in a Group now includes a column for the Total Odometer Miles, and it shows the difference between the beginning odometer and the ending odometer columns This column is only available in the Alternate View. |
| ORA-42 | The author column has been removed from the Report list. |
| ORA-48 | The All Reports panel has been removed, and the Reports list has been widened for a cleaner look. |
| ORA-30 | When you press Help you will be taken to the Omnitracs Knowledge Base. |